...
In the first step we validated the true location of each AP in the library area. This allowed us to obtain a correct mapping between the reported and validated WLAN location. In conjunction with this we conducted a first data verification trial with test handsets in each AP location. In the following we depict a true location of each reported AP in the dataset.
Figure 1a: Location of APs in library Figure Figure 1b: List of APs in each floor
Data Collection Module
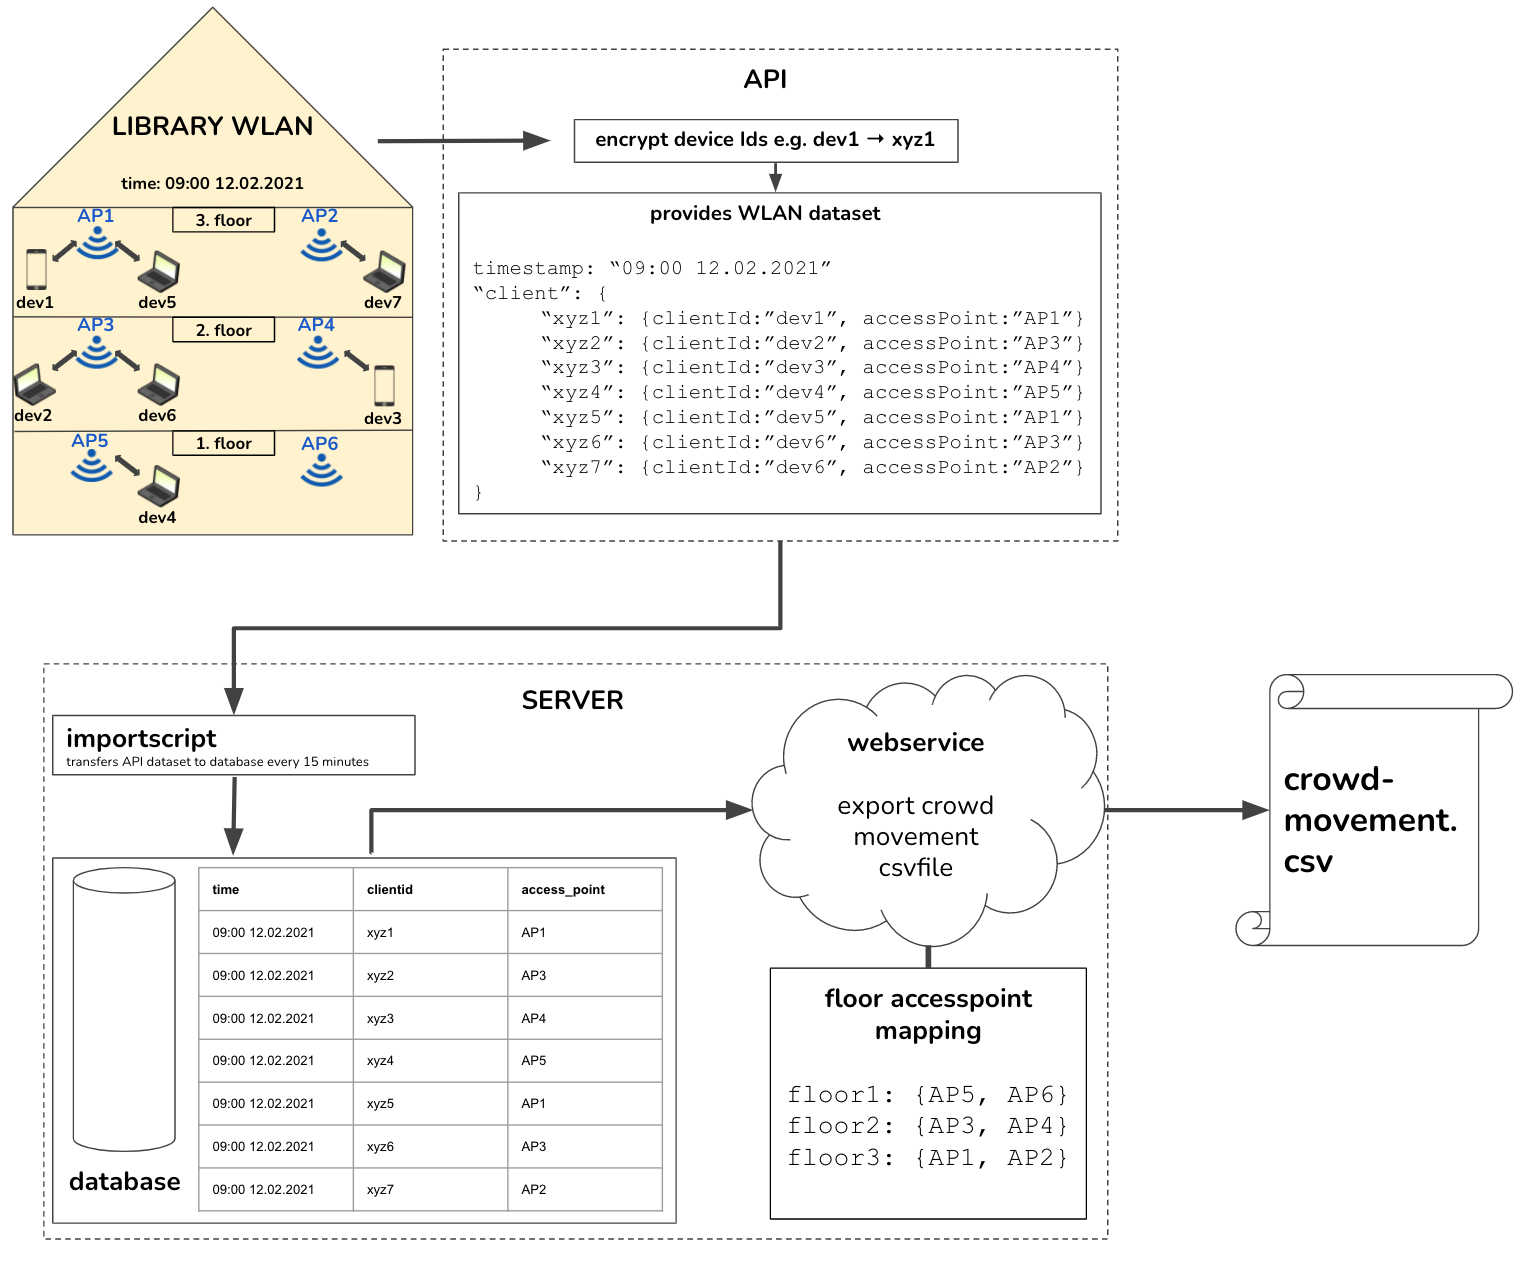
The user flow data is collected via the management platform of the IT department. This data is anonymised and imported to a database structure via the WLAN API, both the database and the API are operated on a virtualised server at E389. In order to allow for data extraction the server offers a password protected web interface that allows for a CSV style extraction.
Figure 2: Infrastructure data collection
This task is continously running on a VM server at the Institute of Telecommunication. The data itself can be requested via a web-interface. This interface allows to select a time range and will export the data into a human readable format in CSV. Attached is a screenshot of this web page. The CSV format is described below.
Figure 3: Visualisation of device counts from Monday to Sunday
To make sure that our data is reliable and correct, we compared our results with the entrance countersystem from the library. In the graph we see the visitors/devices in total in the building from the 6th July 2021 (the visitor numbers where in that time lower due to Covid19 restrictions). We identified several IoT and printer devices being responsible for this offset of the total of wlan devices.
Figure 4: Comparison of entracecounter (red) and connected WLAN devices (blue)
Prediction Model
Another goal is the prediction of the user flow in the library for the following day. An autoregressive (AR) model will be trained by the collected data of previous days.
Further informations AR Wikipedia
In the following picture we see a model that trained with data from 4th and 5h October 2021. The prediction (red) is faced with the real world data (green) of the next day, the 6th October. In this example the prediction works pretty well but it has to be said that in general this approach doesn’t work for all weekdays similar.
Figure 5: Monday+Tuesday Model (red) compared with Wednesday (green)
If we compare the prediction with data of 9th October, which is a Saturday, we clearly see that the previous days are not working for that day. Compared to the user flow picture of the whole week we can see that there is a big difference between during the week and the weekend.
Figure 6: Monday+Tuesday Model (red) compared with Saturday (green)
In the following picture we used the previous weekend to generate a model for the 9th October. Apart from the offset of about 15, this prediction seems far better than the previous one.
Figure 67: previous weekend (Saturday+Sunday) Model (red) compared with Saturday (green)
Example of a crowd-movement.csv
...


